Click to Deploy: Scalable, On-Demand Application Provisioning using Kubernetes
How I built a scalable, declarative platform that deploys and configures apps in Kubernetes for dev, demo, and testing using Go and ArgoCD.

Hayden Roszell
12 minutes to read
•
Jun 18, 2025
As an integration software engineer, one of the first tasks when writing plugin software for flagship products was simple in theory but painful in practice: standing up a functional environment with a baseline configuration.
Spinning up a dev environment meant provisioning infrastructure, configuring authentication, generating certificates, wiring up dependencies, and deploying containers — all through a mix of scripts, disparate documentation, and tribal knowledge.
I found myself spending as much time standing up my dev environment as I would running my tests or implementing my changes. Throughout time, this led me to write bash-based automation forsome of our products, but a non-trivial amount of configuration was still necessary to get all of our products to work together.
I realized that I was likely not the only one with this same problem within my company, especially for those without deep familiarity with virtual machines, networking, and deployment intricacies. In time, it became clear that we needed a better way to spin up reliable, isolated environments on demand — not just for engineers, but also for QA, solution architects, and sales engineers running demos.
I designed the Simple Environment Service to solve this exact problem.
System Overview
When I set out to build the Simple Environment Service, my goal wasn't just to build another deployment tool — it was to create a system that could take a request like "I need a dev environment with these three apps configured like this" and translate it into concrete applications deployed and configured in Kubernetes. I wanted the service to maintain the entire lifecycle of the applications it deployed, from creation, modification, and eventual deletion when its purpose was served.
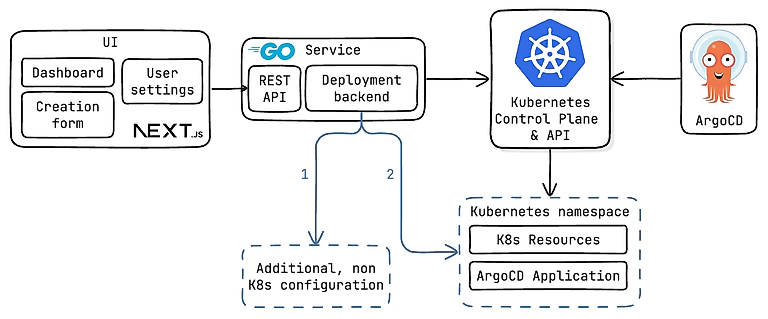
At the heart of the service is a Go backend that exposes a REST API. The service listens for incoming requests from the UI, processes them, and coordinates everything needed to bring a new environment to life
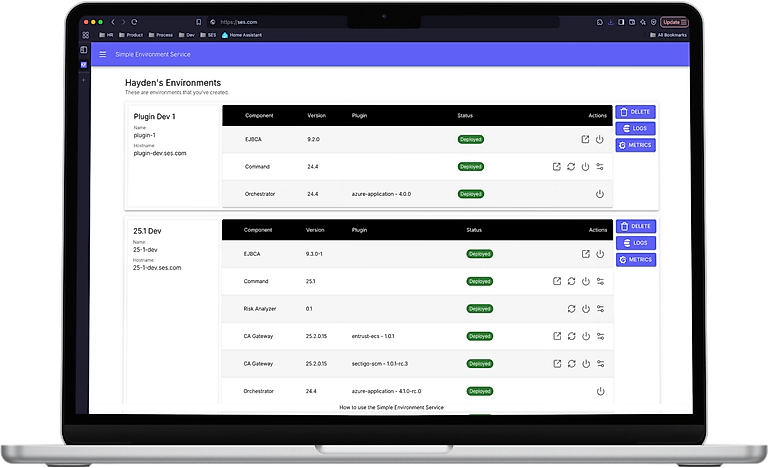
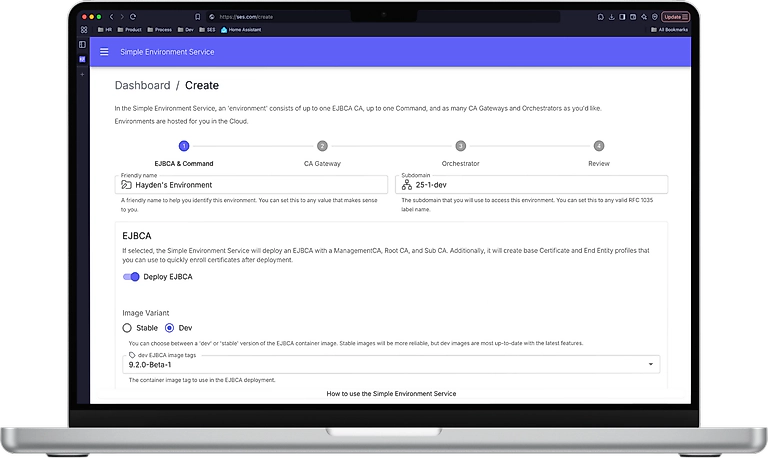
The frontend itself is built with Next.js and gives users a simple interface to interact with the system. They can see a dashboard of their active environments, dispatch actions like reboot and sync, and spin up new environments on demand. From a user’s perspective, it feels like filling out a form and clicking a button.
Once the creation request reaches the backend, the service kicks off an asynchronous, idempotent workflow for each application requested that provisions secrets, configures identity providers, and deploys resources in our cloud provider
Once external services and configuration are ready, the service serializes the configuration to a declarative application spec and sends it to ArgoCD in an Application resource. ArgoCD ensures that the resources are created and remain in sync. Resources in an environment are scoped to their own Kubernetes namespace to isolate them from other environments and making it easy to tear down or recreate.
The end result is a system that can reliably produce complex, multi-service environments on demand — no more scripts, no more tribal knowledge, and no more waiting around for infrastructure to be manually provisioned.
Application Configuration & Job State Management
In the beginning, I wanted to rely solely on Kubernetes to persist the application configuration — Kubernetes offers powerful facilities for this state via Labels and Annotations. The issue I ran into was that applications entail more than Kubernetes Pods and Services; they also rely on resources and services outside the cluster. So, I designed the Simple Environment Service to treat an external Postgres database as the source of truth.
Every application deployed into an environment has a corresponding entry in the database — a complete record of how it was configured and what settings were applied. This decision has two big advantages.
First, it meant environments could be rebuilt from scratch without depending on what was currently running in the cluster. If an admin or user got into the cluster and deleted resources, they could be created without knocking the Simple Environment Service out of sync. Second, it made teardown deterministic. When an environment is deleted, the system knows exactly which non-Kubernetes resources were created and how to clean them up, like OAuth2 clients in the identity provider, or databases in our cloud provider.
Environments themselves act as logical containers. Each application is deployed into a specific environment, and when that environment is removed, its applications go with it — automatically and cleanly. The service makes this relationship explicit: every application is scoped to an environment, and every API operation respects that boundary.
Speaking of the API, each application type has its own set of REST endpoints, offering full CRUD operations. This modular design made it easy to manage each app's lifecycle independently, but it also introduced a challenge: coordination. Some applications depend on others being fully deployed and configured before they can start. That meant the service needed to orchestrate asynchronous workflows that were aware of each other, and more importantly, aware of where other deployments were in their lifecycle.
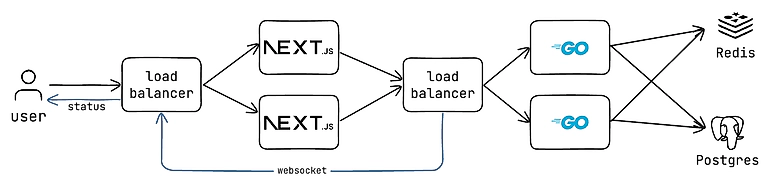
To solve this, I introduced Redis as a shared job state store. Whenever a deployment job runs, it writes its status to Redis. Other jobs can then check this state before moving forward. This approach allowed the service to scale horizontally — deployment jobs could be picked up by any node in the cluster, while still maintaining awareness of the larger environment-level workflow.
This combination of database-backed configuration and Redis-based state tracking gives the system its reliability and predictability. Whether deploying a single app or orchestrating an entire stack, the service knows what to do, how far it's gotten, and what’s next — and it does it all without depending on any one node or runtime instance.
Networking Strategy
Up to this point, I’ve mostly focused on how environments are built — how applications are configured, jobs coordinated, and resources managed. But none of it would be usable without a solid networking strategy.
The cluster running the Simple Environment Service supports many users and many environments, all running in parallel. So, I had to think carefully about multi-tenancy and scalability. My initial instinct was to lean on the cloud provider's Application Gateway. It seemed like a natural fit to use their Ingress Controller, set up routing per environment, and move on.
But as I dug deeper, that approach started to fall apart.
Cloud-managed application gateways, while powerful, come with hard limits on how many routing rules they support. Worse, they're billed per request in addition to data processed. Adding hundreds or even thousands of environments would have meant ballooning expenses, and that just wasn’t acceptable for a system that needed to scale wide by design.
Instead, I turned to something lower level: Istio with the Kubernetes Gateway API .
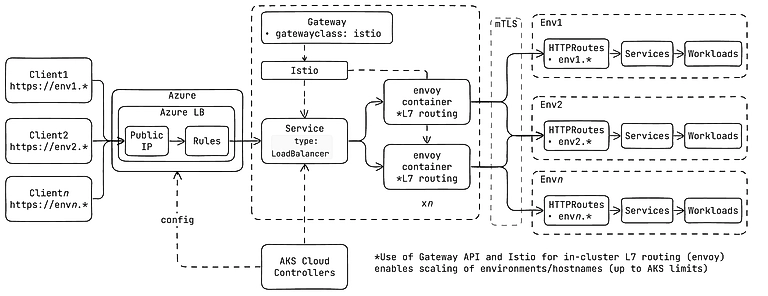
Rather than provisioning one Gateway per environment or wiring up hundreds of rules at the cloud layer, I deployed a single, shared Istio Gateway in the cluster. Istio creates a backing Kubernetes LoadBalancer Service per Gateway. In turn, the cloud provider Controller running in Kubernetes creates a public IP and cloud Load Balancer with a single ruleset targeting the Service in Kubernetes.
This approach enables Istio Envoy proxies to handle all Layer 7 routing into the mesh. Inbound requests from users accessing their applications are matched to the correct environment based on the hostname. This setup gave us near-unlimited routing flexibilitywithout paying per route or hitting arbitrary rule limits by the cloud provider.
And as a bonus, using Istio gave us more than just routing. With mTLS and sidecar proxies , every connection between services was secured by default. Plus, we got built-in observability : latency, error rates, and traffic metrics at the network level — no extra instrumentation needed.
Log and Metrics Aggregation
One of the more understated — but critical — parts of managing applications is understanding what they’re doing when things go wrong. For better or worse, a huge part of using our products has always involved diving into logs. In traditional bare-metal setups, this usually meant SSH’ing into a VM and tailing a text file. That approach didn’t scale, didn’t support multi-tenancy, and certainly didn’t fit into a Kubernetes-native system designed to be ephemeral and dynamic.
When I built the Simple Environment Service, I knew I needed a structured, scalable way to collect logs from each application across environments and surface them in a way that users could actually use. After evaluating a few options, I chose the Elastic Stack because it scales beautifully, and its query and visualization capabilities are incredibly powerful.
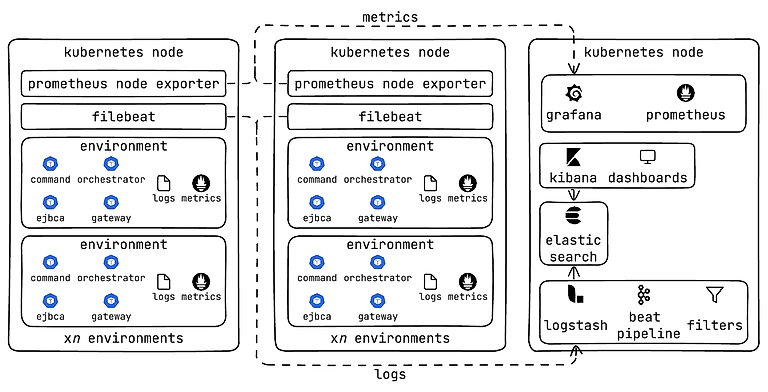
Elastic is deployed using the ECK (Elastic Cloud on Kubernetes) operator, which made it easy to bring up the full stack as a set of managed Kubernetes resources. That includes Filebeat for log collection, Logstash for processing and enrichment, Elasticsearch for storage and indexing, and Kibana for visualization and querying.
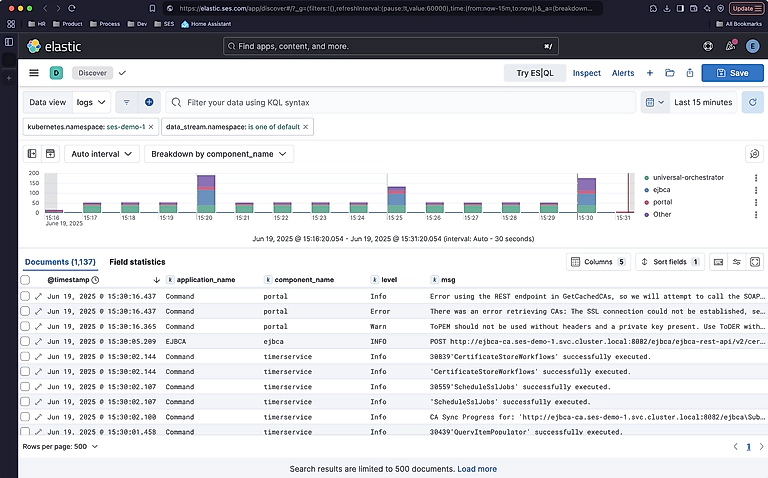
With this pipeline in place, logs from every container — across every environment — are automatically picked up, parsed, and shipped to Elasticsearch. From the user’s perspective, they log into the Simple Environment Service dashboard, click the “Logs” button on their environment, and are taken directly to Kibana, pre-filtered to show logs from their specific namespace.
Metrics were the other half of the observability equation. For that, I deployed the kube-prometheus-stack , which bundles Prometheus, Grafana, Alertmanager, and a set of Kubernetes exporters. This gave us deep insight into compute usage, network traffic, pod health, and more — all without having to manually configure scrape targets or exporters.
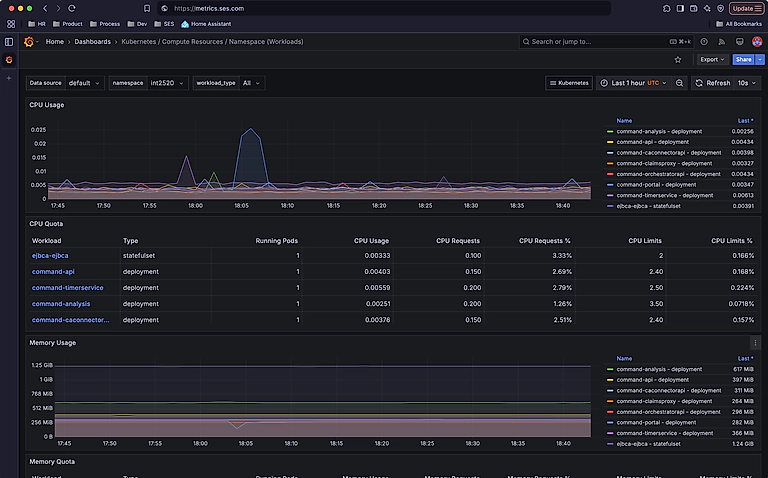
Together, Elastic and Prometheus gave the system full-stack visibility — logs for what happened and metrics for how it’s performing.
Supporting Infrastructure and How it's Deployed
Behind the simplicity of a click-to-deploy environment lies a surprisingly complex system. The Simple Environment Service depends on a deep stack of supporting infrastructure — identity, observability, ingress, data stores, and more — all working in concert to deliver a seamless experience to the user.
From day one, I knew that managing this by hand wasn’t going to cut it. The system needed to be reproducible, version-controlled, and easy to stand up from scratch. That meant committing to Infrastructure as Code.
I evaluated both Terraform and Pulumi for the job. I ended up choosing Pulumi, primarily because it let me write infrastructure in native Go — the same language I was using to build the backend service. That made some aspects of infrastructure management feel seamless, especially when it came to handling secrets and dynamic logic.
But looking back, I’d make a different choice.
While Pulumi gave me flexibility early on, it also introduced complexity that didn’t always pay off. The Go-based infrastructure code could be expressive, but I found it to be extremely slow and somewhat unreliable as I added more and more resources. For a system like this, where the infrastructure is large but relatively static, Terraform would have been a better tool.
That said, Pulumi still gets the job done. It deploys everything:
- Azure Kubernetes Service (AKS) as the foundation
- Azure DNS , with external-dns in-cluster to create A records automatically when HTTPRoute resources are sent to Kubernetes
- Azure SQL Server backed by Elastic Pools for cost-effective scalability
- Istio , for ingress routing, security, and service mesh
- cert-manager , to issue publicly trusted TLS certificates via Let’s Encrypt
- ArgoCD , powering GitOps deployment of system components and dynamic deployment of applications for environments
- Elastic Cloud on Kubernetes (ECK) , which provisions the full Elastic Stack
- kube-prometheus-stack , for cluster monitoring and alerting
- Redis , for job state and coordination (and some caching I didn't discuss)
- Ory Hydra , serving as our OAuth2/OIDC identity provider
Everything, from base networking to control planes to observability tooling, is bootstrapped, versioned, and deployed through Pulumi. That means the entire system can be spun up in a new region or tenant with a single command and updated safely through CI/CD pipelines.
Conclusion
What began as a tool to simplify my own development workflow has grown into a critical part of how some teams internally build, test, and demo our products. At the time of writing, the Simple Environment Service is used by over 20% of the company, powering more than 100 active environments across a fleet of 40+ Kubernetes nodes.
Behind the scenes, the networking layer handles over 1.8 million requests every day, and the logging pipeline ingests upwards of 68 million records — providing real-time visibility and stability at scale.